

Global Kinetic Warfare, 1996–2026
A Thirty-Year View of rising conflict counts, concentrated lethality, and a more fragmented security world
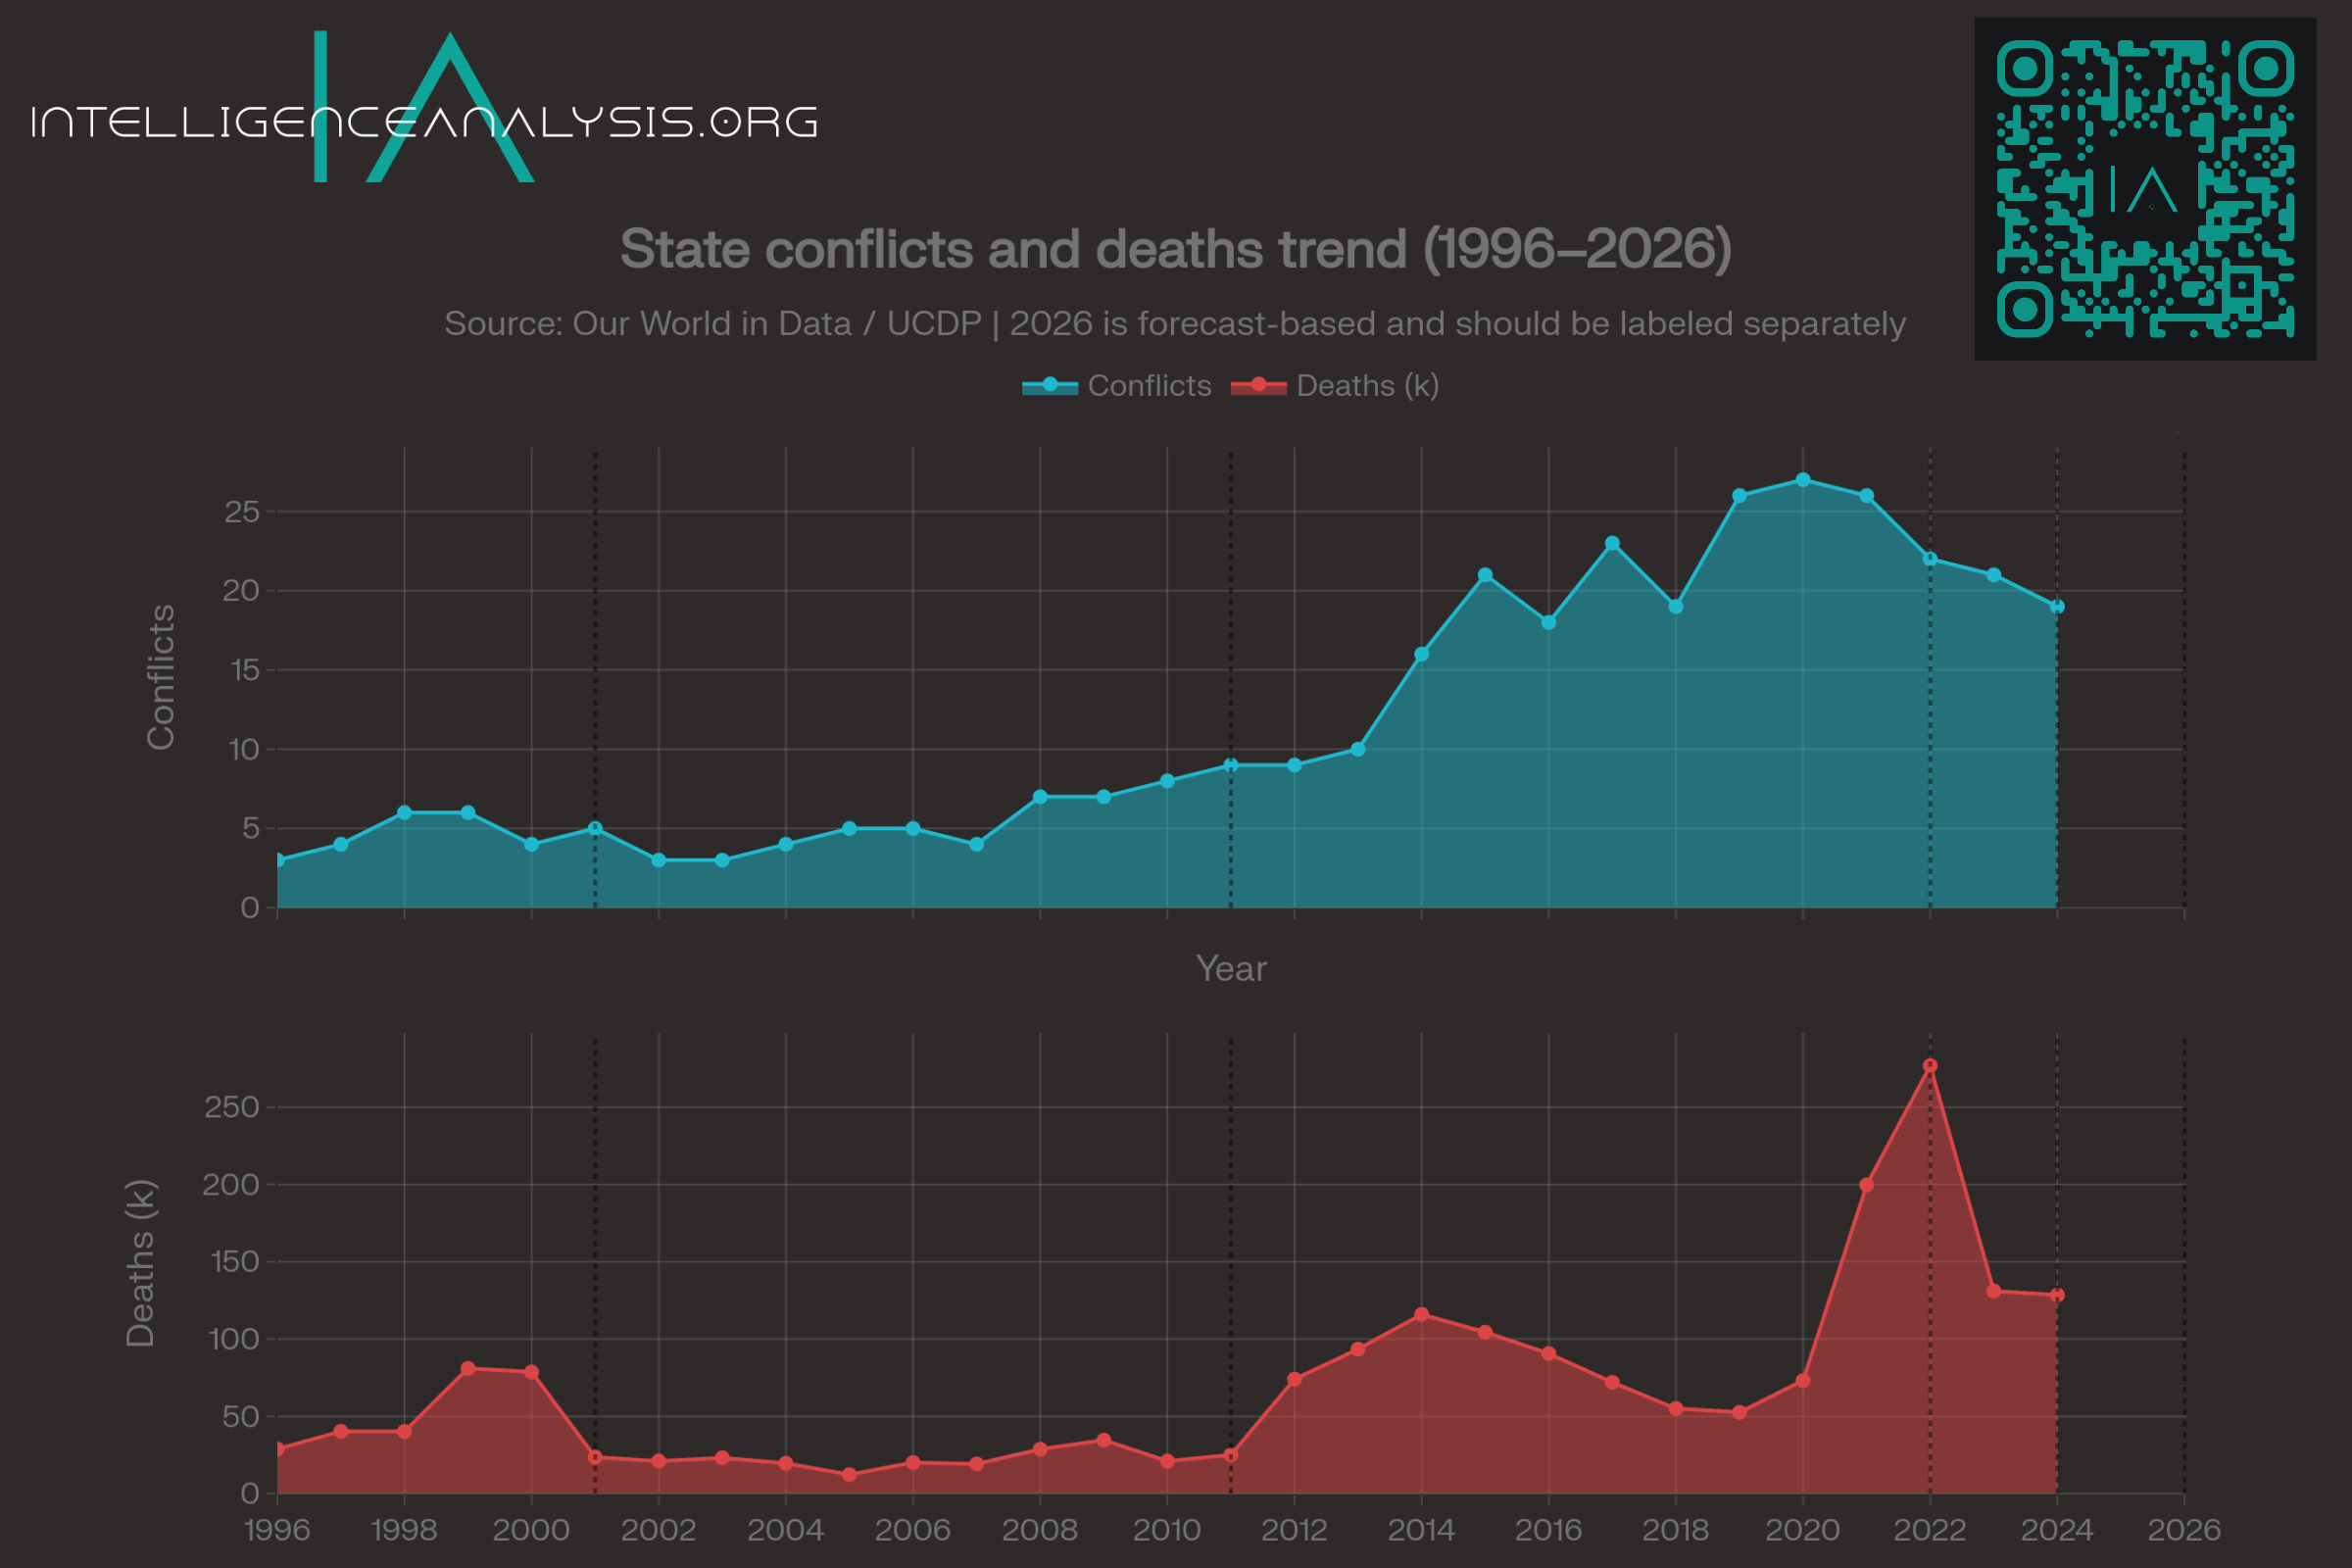
The world is experiencing a surge in armed conflict that has not been seen since the post-World War II era. Over the last three decades, the number of active state-based conflicts has climbed steadily, while battlefield deaths have spiked unevenly around a small number of extremely lethal wars. The most recent data show a record-breaking pattern: 2024 set a new high for the number of state-based conflicts, and forecast systems project that 2026 will remain among the deadliest years in the modern record.
This post uses the UCDP data series from PRIO and Our World in Data to trace the arc of global kinetic warfare from 1996 to 2026. It separates two closely related but distinct patterns: how many conflicts exist and how many people die in them. The story is not simply that war has increased in a straight line. The story is that the conflict system has become denser, more fragmented, and more concentrated in a few extreme theaters.
What we mean by kinetic warfare
The term kinetic warfare usually refers to violence that physically destroys, injures, or kills. In conflict research, the clearest and most comparable measure is state-based armed conflict. UCDP defines a state-based conflict as violence between two armed groups where at least one party is a state, and where at least twenty five battle-related deaths occur in a year.
This definition is narrower than all violence. It does not include non-state conflict between armed groups without a state actor, one-sided violence against civilians, cyber operations, or gray-zone coercion. It is a disciplinary choice that keeps the long-run series consistent and defensible.
Using this lens, we can ask three questions:
Has the number of active conflicts increased over the last thirty years?
Have battle deaths increased, and are they spreading evenly or concentrating?
How has the geographic and structural pattern of war changed?
The answers are clear: the number of conflicts has risen to a record high, deaths remain extremely elevated but are concentrated in specific wars, and the global conflict system has become more fragmented and overlapping.
The long view: 1996 to 2024
The post-Cold War environment in the mid-1990s was not peaceful, but it was different from the security world that emerged in the 2010s and 2020s. The 1990s were marked by regional wars, civil conflicts, and intervention, but the conflict system was still less dense and less globally distributed than today.
The UCDP series shows a gradual but persistent rise in the number of state-based conflicts from the late 1990s through the 2010s. The trend is not a sudden jump. It is a densification of the global conflict map, with more countries hosting active conflicts and more states involved in multiple wars at the same time.
The 2001 shift after the 9/11 attacks changed the security environment in ways that are still visible. The post-9/11 period intensified counterinsurgency, foreign intervention, and transnational militancy. Afghanistan and Iraq became major conflict nodes, and the regional spillover from those wars helped to diffuse conflict patterns across larger parts of the Middle East and Africa.
The 2011 Arab uprisings marked another structural break. State collapse in Syria, civil war escalation in Yemen, and political breakdown in parts of North Africa and the Horn of Africa created overlapping conflict systems. These theaters did not just add more wars. They created complex, multi-layered conflict environments where domestic, regional, and international actors all fought in the same space.
The 2022 Russian invasion of Ukraine brought large-scale conventional interstate war back to Europe. This was a strategic shock that renewed attention on artillery, industrial warfare, and escalation risk. Ukraine also became the deadliest conflict in the world by battle deaths, and it pushed global lethality sharply upward.
The 2024 data point is the clearest benchmark in the modern record. PRIO and UCDP reported that 2024 set a historic peak for state-based conflicts, with sixty one active conflicts across thirty six countries. That is the highest number of conflicts since the series began in 1946. The year was also the fourth deadliest since the Cold War ended, with roughly one hundred twenty nine thousand battle-related deaths. The main drivers were the civil war in Ethiopia, the ongoing war in Ukraine, and the bombings in Gaza.
This pattern shows the core insight of the deck: conflict prevalence and lethality do not move in lockstep. A year can have more conflicts without setting a new death toll record, because lethality is concentrated in a small number of wars.
Prevalence versus lethality
The most important distinction for understanding global kinetic warfare is between how many conflicts exist and how deadly they are. The number of conflicts tells you how widespread instability is. The number of deaths tells you how much physical destruction is occurring.
The UCDP data series shows that the count of active state-based conflicts has trended upward over the last thirty years. The count reached a record high in 2024. This is not a smooth upward line. There are periods of acceleration and periods of slower growth, but the overall direction is clear.
Battle deaths behave differently. They are much more spiky. In some years, the death toll is moderate. In other years, it is extremely high. The spike is driven by a small number of massively destructive wars. In 2024, the death toll was about one hundred twenty nine thousand. In 2025, the death toll was even higher, with Ukraine alone accounting for nearly sixty thousand recorded deaths.
The result is a pattern where the global conflict map is denser, but the human cost is concentrated. This is not a world where every war is equally deadly. It is a world where a small number of extreme wars account for most of the fatalities.
This is why the chart of conflicts and deaths looks different. The conflict count line trends upward. The deaths line spikes and falls. The two lines do not move together.
Regional patterns: where lethality concentrates
The geographic pattern of conflict has shifted over the last three decades. Africa remains the most conflict-affected region by number of active conflicts. The Middle East and parts of Asia also have high levels of conflict activity. Europe had fewer conflicts in absolute terms, but it became the deadliest region in recent years because of Ukraine.
The 2024 regional data show that Europe had the highest level of conflict-related fatalities, with over seventy five thousand deaths. The Middle East had about thirty thousand deaths. Africa had about seventeen thousand. Asia and Oceania had about five thousand. The Americas had the lowest level of fatalities.
The 2026 forecast from the VIEWS AI model confirms that lethality will remain concentrated in a few theaters. The model projects that Ukraine will have the highest battle-related death toll in 2026, at about twenty eight thousand deaths. Palestine and Israel will have about seven thousand. Sudan will have about four thousand. Pakistan, Nigeria, Ethiopia, Somalia, Syria, Yemen, and Burkina Faso will all have lower but still significant death tolls.
This pattern shows that the global conflict system is not evenly distributed. It is heavily clustered. A few countries and regions absorb the majority of fatalities, while the rest of the world experiences lower levels of lethal violence.
Structural changes: fragmentation and overlap
One of the most important structural changes in the last thirty years is the rise of fragmentation and overlap in the global conflict system. More countries now face multiple simultaneous conflicts. PRIO reports that more than half of conflict-affected states had two or more state-based conflicts in 2024. Nine countries had three or more.
This is a different pattern from the post-Cold War era. In the 1990s, conflicts were more isolated. In the 2020s, conflicts are layered. Proxy warfare, transnational militancy, and regional intervention create environments where domestic, regional, and international actors all fight in the same space.
This makes the global conflict map denser and harder to stabilize. It also makes diplomacy and deterrence more difficult. The world is not just seeing more wars. It is seeing a more complex war system.
What the chart does not show
The UCDP lens is useful, but it is not complete. It does not fully capture non-state conflict, one-sided violence against civilians, cyber operations, or gray-zone coercion. These categories matter for understanding the full security environment.
Non-state conflict in 2024 included seventy four conflicts that resulted in about seventeen thousand battle-related deaths. One-sided violence against civilians was conducted by forty nine actors in 2024, including fourteen governments. These numbers are significant, but they are not included in the main state-based conflict series.
Similarly, cyber operations and gray-zone coercion are increasingly important in modern conflict, but they are not counted as battle deaths. This is a limitation of the lens, not a flaw in the data. It is a disciplinary choice that keeps the long-run series consistent.
Strategic implications
The strategic implication of the last thirty years is clear. Policymakers face more simultaneous crises, more regional spillover risk, and more difficult stabilization problems. The world is not just seeing more war. It is seeing a more complex war system.
The trend is not a straight line upward. The conflict system has densified, but lethality has concentrated. The world has more conflicts, but the death toll is still driven by a small number of extreme wars. This is why the conflict map is denser and harder to manage.
The right forecasting question is not whether war exists. It is how war clusters and spreads. Where will the next extreme war emerge? Which regions will absorb the next spike in fatalities? How will the global system respond to the next structural break?
A note on 2026
The 2026 data point is not final historical data. It is a forecast from the VIEWS AI model. The model uses machine learning techniques and a large-scale data pipeline to anticipate where and how severely armed conflict is likely to escalate. It is not a certainty. It is a best-estimate scenario.
The model projects that Ukraine, Palestine/Israel, Sudan, Pakistan, and Nigeria will see the highest battle-related death tolls in 2026. The numbers are lower than the recorded deaths in 2025 for Ukraine and Palestine/Israel, reflecting the possibility that both conflicts could end or de-escalate. However, the model also tends to err on the conservative side, and the projected death toll for Sudan has more than doubled in the past month, underscoring the rapid deterioration of the security situation.
The forecast should be seen as a warning bell for policymakers, the UN, and aid organizations. It highlights where conflict intensity is most likely to surge next year, giving governments and humanitarian actors a stronger basis for early planning and saving lives.
The bottom line
The world now has more state-based conflicts than at any time in the modern record. The number of active conflicts reached a record high of sixty one in 2024. The conflict system has become denser and more fragmented, with more countries hosting multiple simultaneous conflicts.
Battle deaths remain extremely elevated, but they are concentrated in a few theaters. Ukraine, Palestine/Israel, Sudan, and a small number of other countries absorb the majority of fatalities. The 2026 forecast suggests that lethality will remain concentrated in these same theaters.
The core takeaway is that the conflict system has become more complex. The world is not just seeing more war. It is seeing a more complex war system, with more simultaneous crises, more regional spillover risk, and more difficult stabilization problems.
Download the Powerpoint Presentation and/or PDF here.
Sources
Peace Research Institute Oslo. Conflict Trends: A Global Overview, 1946–2024. PRIO Paper. 2025.
Peace Research Institute Oslo. AI model warns of deadliest conflict zones in 2026. PRIO News. 2025.
Uppsala Conflict Data Program. UCDP: Sharp increase in conflicts and wars. Uppsala University Press Release. 2025.
Our World in Data. War and Peace. 2024.
Our World in Data. Deaths in state-based conflicts by region. 2025.
ACLED. Conflict Index. 2025.
https://industrialcyber.co/analysis/digital-battlegrounds-evolving-hybrid-kinetic-warfare/
https://www.osavul.cloud/blog/why-modern-warfare-isnt-always-about-weapons
https://www.eccu.edu/blog/cyber-warfare-2026-trends-threats-ai/
https://www.dni.gov/index.php/gt2040-home/gt2040-deeper-looks/future-of-the-battlefield
https://reliefweb.int/report/world/ai-model-warns-deadliest-conflict-zones-2026
https://claws.co.in/wp-content/uploads/2026/01/CSDR_Beyond-the-Kinetic_Jan-2026.pdf